Home / NCAA Quad Wins and Losses Tracker
Bracket ResearchNCAA Quad Wins and Losses Tracker
(Updated with games through 3/15/2026)
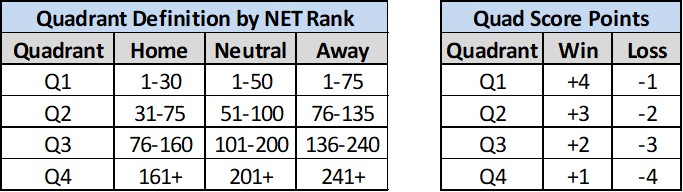
Track your college basketball team's Quad 1 wins along with their record in the other three quads. Also, click here for more info on the NET and t
- Click column header to sort
- Hover over number to see list of teams